A collection of
charts made by
OEB services.
charts made by
OEB services.
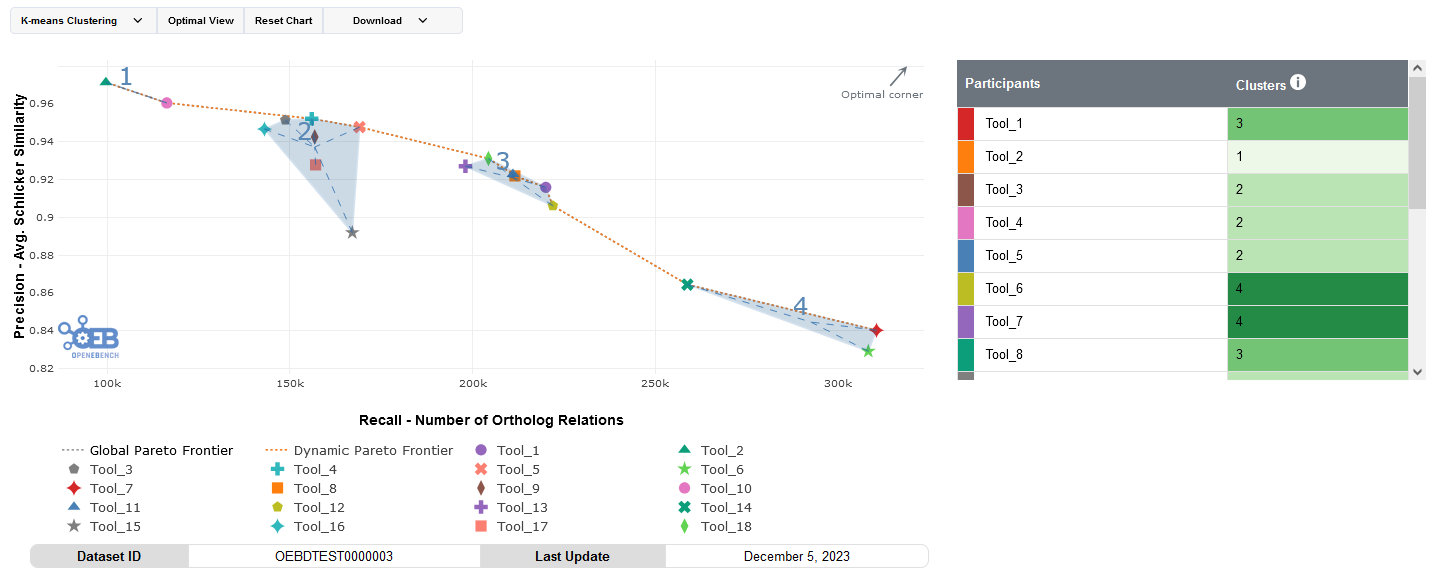
This is a collection of graphs made by OEB services. The graphs are made using the Plotly.js library.
Installation
To install the graphs, you can use the following command:
npm i @inb/oeb-widgets-graphsUsage
In base javasctipt applications
Add the installed package to your javascript file.
import '@inb/oeb-widgets-graphs';<widget-element
id="widget-element"
:data=graphData
:type=graphType>
</widget-element>
In base HTML applications (without a framework)
Add the installed package to your HTML file.
<script type="module" src="https://cdn.jsdelivr.net/gh/inab/oeb-widgets-graphs@refs/heads/main/dist/oeb-widgets-graphs.umd.js"></script><widget-element
id="widget-element"
data=graphData
type=graphType>
</widget-element>
const graphType=JSON.stringify("bar-plot");
const myComp = document.getElementById('widget-element');
// Change the type and data of the graph
let type = JSON.parse(graphType);
myComp.type = type;
myComp.data = graphData;